Meta spent more on property and equipment than it generated in operating cash during the September quarter. Oracle did the same in its August quarter. Meta's cash balance fell; Oracle's rose. Neither observation can be explained by subtracting capex from operating cash and calling the answer a new borrowing requirement.
The financing question is which combination of operating receipts, existing assets, equity, partners and borrowing supports the whole cash calendar. The two cases below reconcile that calendar using filed cash-flow statements. They are consolidated-company accounts with different quarter ends, not an allocation of dollars to AI or a synchronized sector total.
Three cash measures that answer different questions
USD billions. Meta's quarter ended September 30, 2026; Oracle's ended August 31, 2026.
| Measure | Meta | Oracle |
|---|---|---|
| Operating cash flow | 32.786 | 23.103 |
| Cash purchases of PP&E or reported cash capex | 33.942 | 28.499 |
| Operating cash less cash capex | -1.156 | -5.396 |
| Reported free cash flow | -2.120 | -5.396 |
| Change in cash, including restricted cash | -4.917 | +7.645 |
Meta's free-cash-flow definition also deducts $0.964bn of finance-lease principal. That is a cash payment, not a second purchase of the leased asset. Oracle's reviewed rows do not separately establish an equivalent finance-lease-principal figure. Its $0.830bn net capex-financing repayment remains under the company's own financing label. Meta cash flows and FCF reconciliation · Oracle cash flows and reconciliations.
The common capex subtotal measures investment relative to operating cash. Issuer FCF applies each company's stated definition. The final cash movement includes the rest of investing, financing and currency translation. Treating those three answers as interchangeable obscures who supplied capital and what was spent elsewhere.
Meta used cash and recycled capital without new quarterly long-term debt proceeds
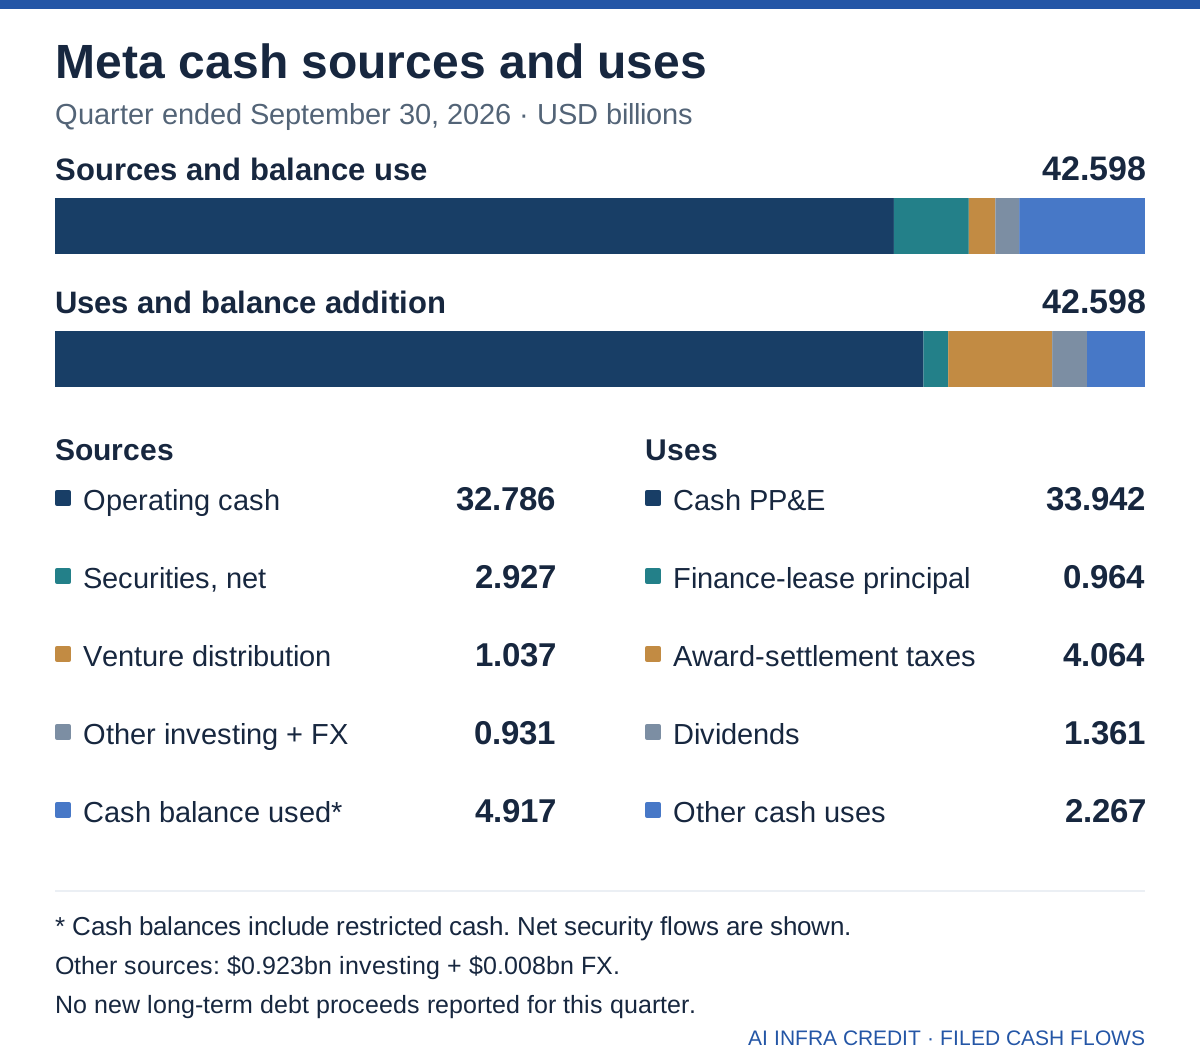
Select the chart to open the full-size figure.
The chart nets sales and maturities of marketable securities against purchases, producing a $2.927bn inflow. A data-center venture distribution contributed another $1.037bn. Other investing flows added $0.923bn; the $0.008bn FX effect is a reconciliation item, not financing. The remaining balance came from a $4.917bn decline in cash, including restricted cash.
Uses extend beyond the headline capex number. Equity-award settlement taxes consumed $4.064bn despite zero reported Class A repurchases; dividends consumed $1.361bn. Other cash uses include private investments, held-for-sale assets, acquisitions and other financing flows. Both displayed columns total $42.598bn. This is a whole-company reconciliation, not a claim that a particular receipt paid a particular GPU invoice. Filed quarterly cash-flow statement.
Meta reported no long-term debt issuance proceeds in this quarter. Its $24.910bn year-to-date net proceeds belong to the May financing. Earlier borrowing can support a later opening cash balance; it must not be counted again as a new quarterly receipt. The absence of a new receipt also does not establish that the debt market was unavailable. Meta 10-Q, Note 9 and capital resources.
The venture receipt illustrates another route. Meta contributed net assets to a Texas data-center venture and received a cash distribution while retaining a 20% interest. The asset contribution is not another cash receipt. Future funding, leases and residual-value support remain part of the arrangement. Capital recycling can bring money back before the infrastructure finishes earning it, but it does not erase the obligations that make the structure investable. Meta 10-Q, Note 5.
Cash balances and financing options have different clocks
Meta's cash-flow statement closes at $24.354bn, including $13.132bn of restricted cash. The separate $82.449bn cash-and-marketable-securities measure includes securities but excludes those restricted balances. They are different accounting perimeters, not two independent reserves to add together. The chart deliberately retains the cash-flow statement's scope; it does not call every dollar freely deployable. Cash reconciliation and Note 4.
The newly approved Class C structure belongs to a third clock: possible future capital. The October filing describes expected charter effectiveness on January 19, 2027 and a stock dividend to existing holders. A stock dividend does not deliver cash to the company. A later primary sale could raise capital, but its size, price and execution would be separate events. Creating a funding instrument is not the same as funding the September quarter. Meta October 21 Form 8-K.
Oracle raised equity while customer funding was already inside operating cash
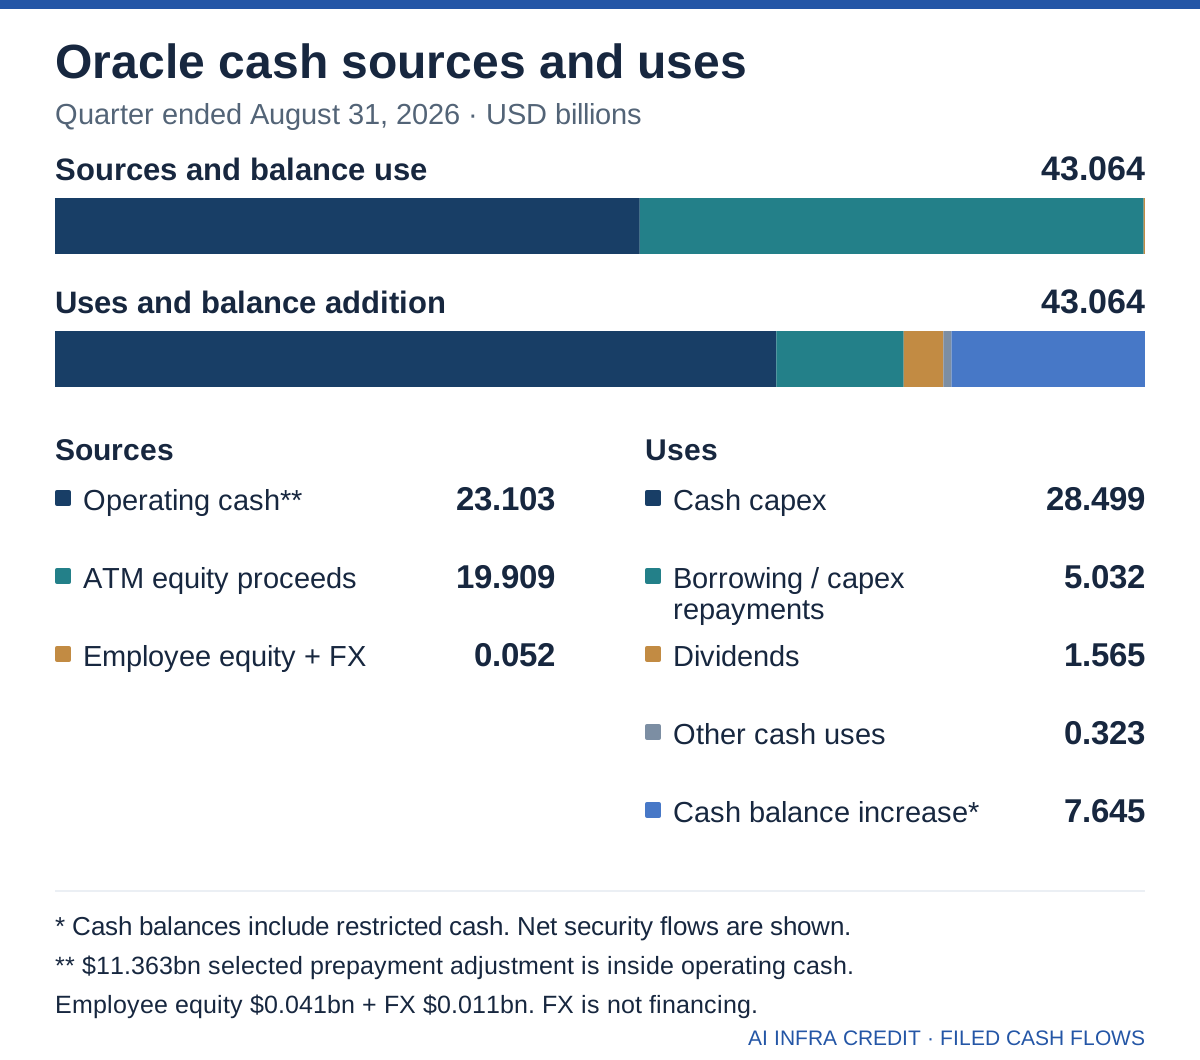
Oracle received $19.909bn of net ATM equity proceeds. After capex, borrowing repayments and other uses, cash including restricted cash still increased by $7.645bn. A negative capex subtotal therefore coexisted with a growing cash balance. The exact original rows and the netting used in this chart are available in the accompanying ledger. Oracle quarterly cash flows.
The tempting chart error is to stack customer prepayments above operating cash. Oracle's $23.103bn CFO already contains the $11.363bn increase in deferred revenues from customer prepayments with a significant financing component. Adding it again would invent an extra source. Subtracting it produces an arithmetic subtotal of $11.740bn, not normalized cash generation or a no-contract counterfactual. It is also a selected disclosed component, not every gross customer advance.
The equity program has its own boundary. Oracle says the $20bn ATM program was fully utilized during the August quarter. Its proceeds belong in the historical cash bridge; the same program is not also an unused $20bn financing reserve. A later authorization would need its own evidence. Oracle 10-Q, Note 7.
Before the other three hyperscalers report
Our public forecast expects the combined September-quarter capex subtotal for Microsoft, Alphabet, Amazon and Meta to turn negative, with approximately 60% subjective confidence. It remains unresolved as of October 25. A result of zero or above would not satisfy it.
For this comparison, the operational definition is reported operating cash flow minus cash purchases of PP&E, excluding finance-lease principal. The original post did not spell out those exact line items; this clarification preserves the definition behind our previously published +$6.709bn June baseline, before the other three September results. It is not a forecast of issuer-defined FCF or bond issuance.
Meta contributes -$1.156bn to the September test. The other three companies must therefore sum to less than +$1.156bn for the combined result to be negative. Their June subtotal was +$4.963bn. Keeping those old observations unchanged and inserting Meta's new result would still leave +$3.807bn. That is an illustration, not a September result—and it shows why Meta alone does not settle the call.
A later Alphabet reply expressed an expectation that its gap would turn positive. It was not a published joint Alphabet-and-Amazon forecast. No unpublished second leg or joint score is added here. The dated June ledger remains unchanged.
The financing test is availability on the payment date
The cases weaken a false binary: either operating cash covers every investment, or the bond market must supply the difference immediately. Existing cash, asset recycling, equity and customer funding can all support expansion. None is free: cash buffers can shrink, equity changes economic ownership, partners receive contractual rights, and customer advances leave delivery obligations.
The constructive question is which mix keeps useful capacity moving without concealing the next cash requirement. Repeated deficits become more constraining when unrestricted buffers decline, asset sales cannot be repeated, advance receipts slow, or funding arrives after committed payments start. Evidence of replacement capital, delivery-aligned payment schedules and durable cash generation would support a faster buildout. A negative subtotal alone does not answer that forward-looking question.
Use the cash-flow ledger and prediction checkpoint, verifier, chart generator and field guide. The checks reproduce the two cash bridges and preserve unknown September observations; they do not forecast future market access. These two dated cases are a first installment, not the completed five-company September comparison.
The same lease cash can produce a different capex gap
October 26 follow-up. A useful question in a public discussion is whether new lease commitments should be added to capex. The answer starts with three separate records: cash paid in the period, noncash assets obtained through leases, and payments promised for future periods. Adding them produces a larger number, not a more comparable cash measure.
The distinction also matters for our own operating-cash-minus-cash-PP&E subtotal. Under U.S. GAAP, a finance lease puts principal payments in financing cash flow, while an operating lease puts its lease cash payment in operating cash flow. The subtotal can therefore change even when the selected economic cash payments do not.

Open the full-size cash comparison
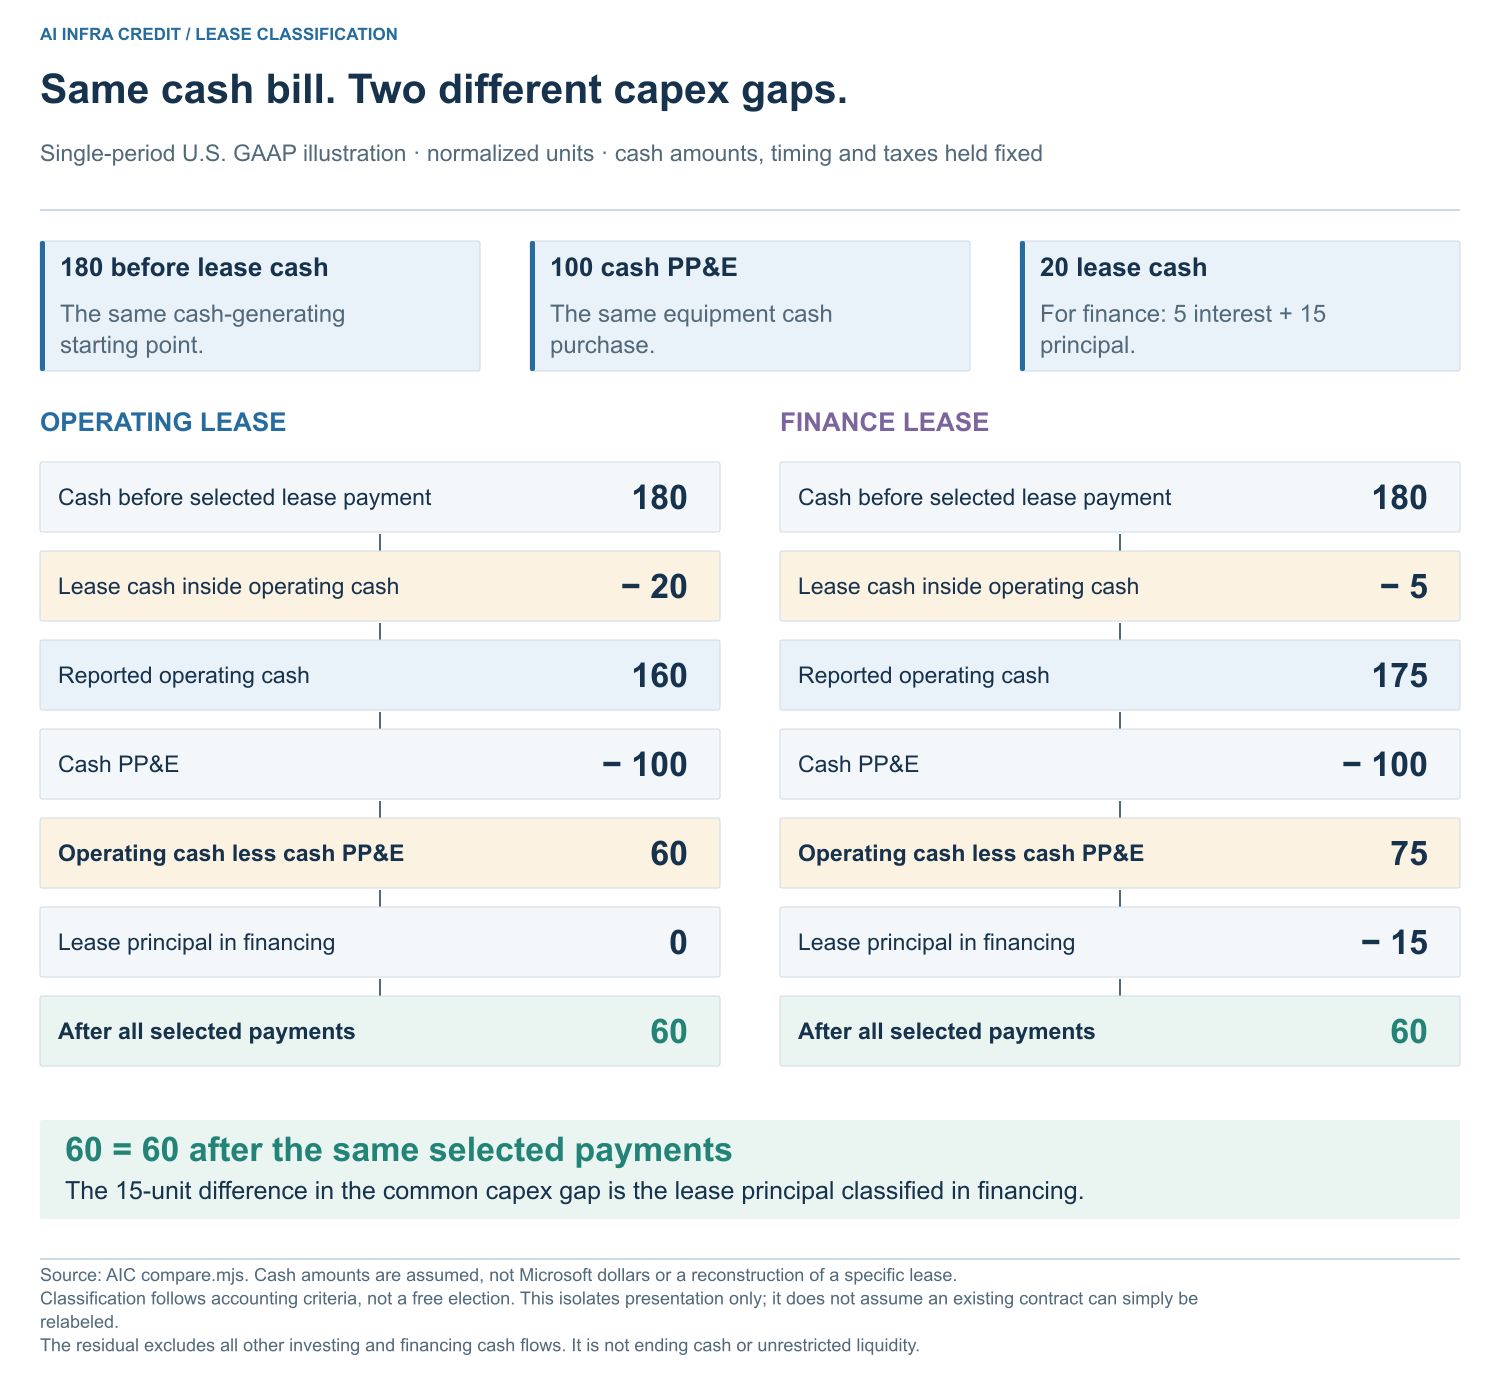
This is a single-period classification illustration with cash amounts, timing and taxes held fixed—not an accounting election or a reconstruction of Microsoft's leases. Actual classification follows accounting criteria. A finance-to-operating shift can lower this capex subtotal without an equal deterioration in total cash left after lease payments. Conversely, financing classification can make the subtotal look stronger without creating cash.
Microsoft has three different investment ledgers
The real example below is Microsoft's full fiscal year ended June 30, 2026, not its upcoming September quarter. Operating cash of $182.935bn less cash PP&E of $115.948bn gives $66.987bn. After $3.101bn of finance-lease principal, the selected cash subtotal is $63.886bn, still before other investing and financing. Operating-lease cash and finance-lease interest are already inside operating cash; subtracting them again would double-count. Microsoft FY26 cash flows and Note 13

Open the full-size Microsoft comparison
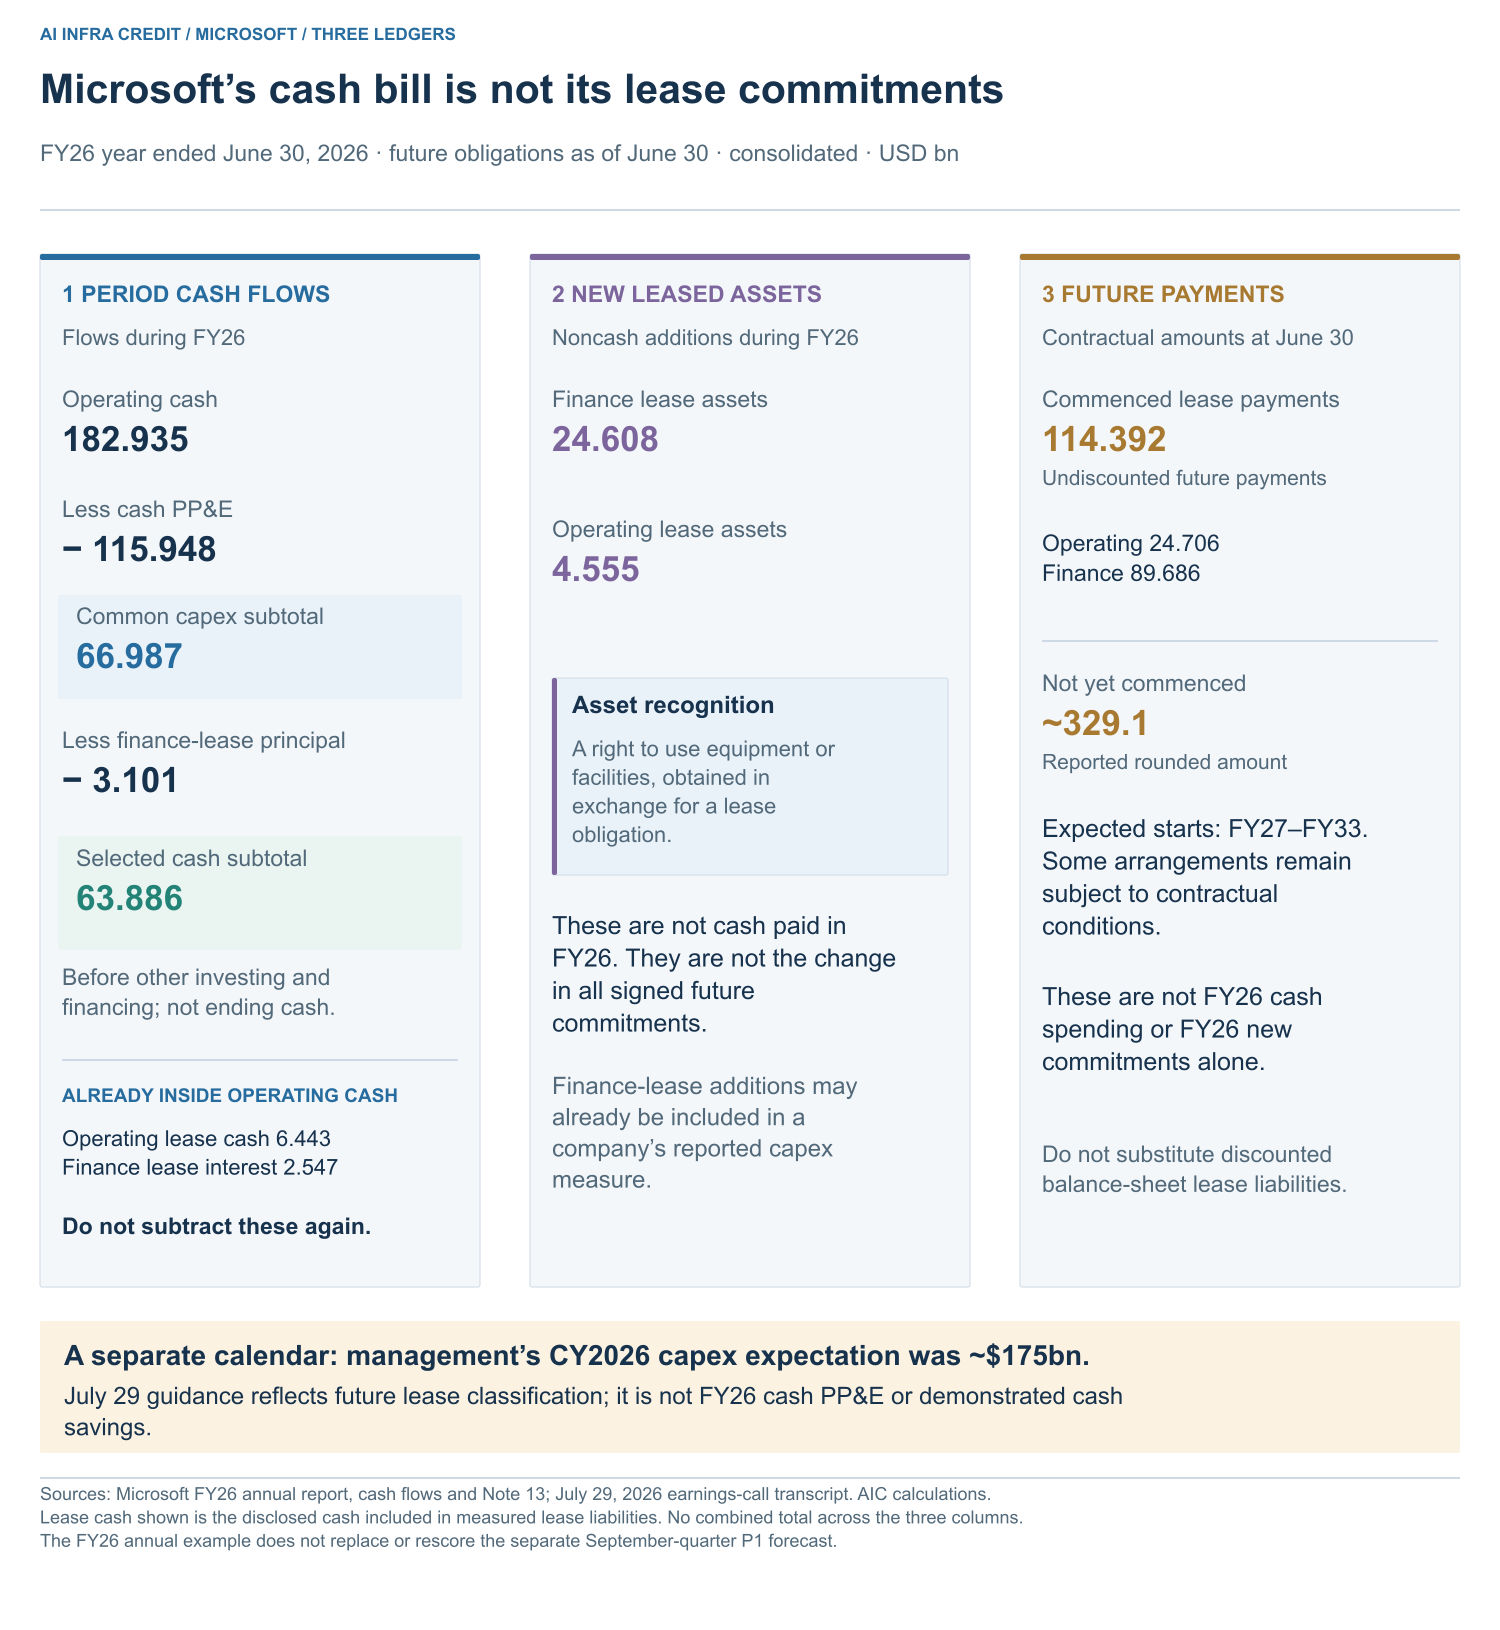
Management's approximately $175bn calendar-2026 capex expectation is another scope. The July 29 call linked its presentation to the extension of estimated datacenter and office-building useful lives from 15 to 25 years, effective from FY27. More future leases would classify as operating leases, which management excludes from capex. Investment expectations were otherwise unchanged, and the expected FY27 operating-income benefit was minimal. This was not a 25-year GPU depreciation announcement or evidence of cash savings. July 29 earnings call
A comparison that survives the next earnings release
Keep period cash, new leased assets and future obligations in separate columns. Label whether each amount is a cash flow, a noncash addition, a balance or guidance. Preserve dates and company definitions. A missing finance-lease-principal disclosure remains unknown, not zero.
Our P1 forecast still uses its original operating-cash-minus-cash-PP&E definition and the unchanged June-quarter combined baseline of +$6.709bn. The additional subtotal after finance-lease principal is a separate analytical view, not a way to change the forecast's score. Neither subtotal is, by itself, all-in investment cash, ending liquidity or a borrowing requirement.
The reusable package includes source data, a blank comparison template, the calculation, results, figure generator and usage notes.